Queensland Government Shame File
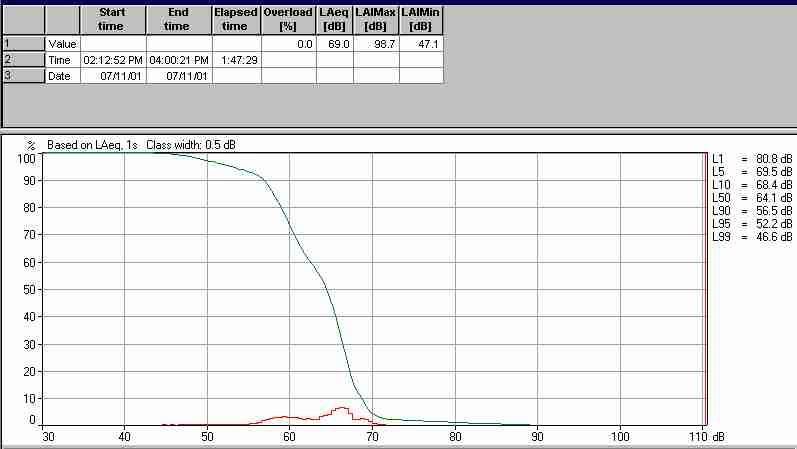
Chart shows 1% of time readings over 80.0 dB and 50% of time over 64.1 dB and
99% of the time noise above 46.6 dB (taken as background level)
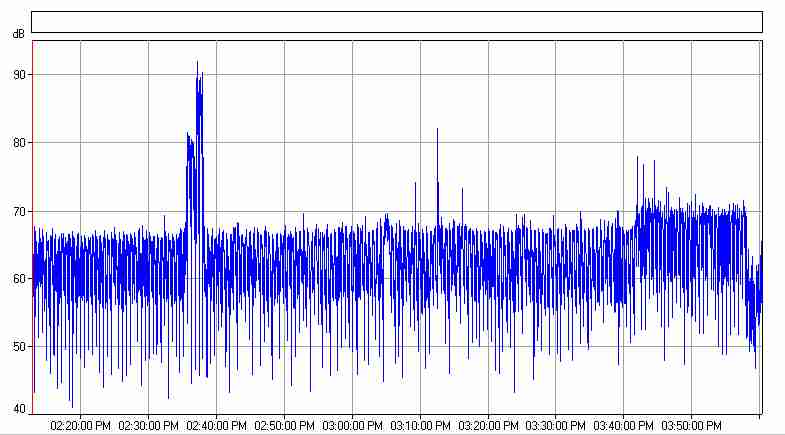
Total printout of noise results until just after noise stopped.
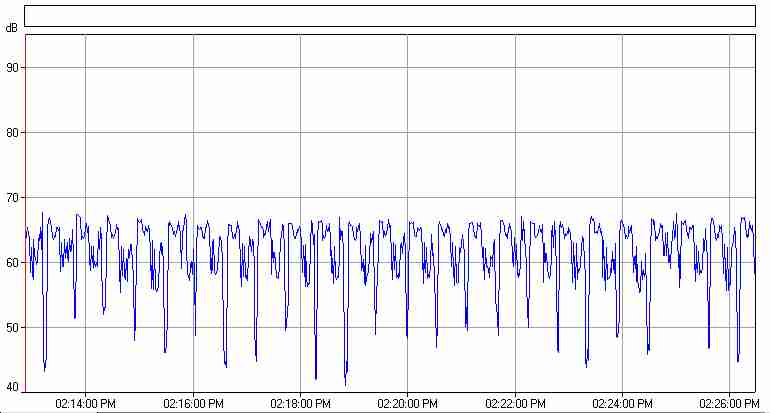
Start of noise readings taken ~2 metre from house wall.
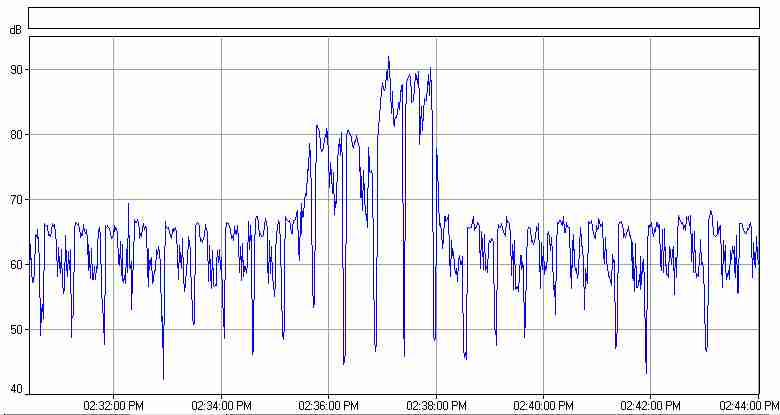
High peaks where SLM was about 2-3 metres from front of car. Other reading taken 2 metres from house's front wall.
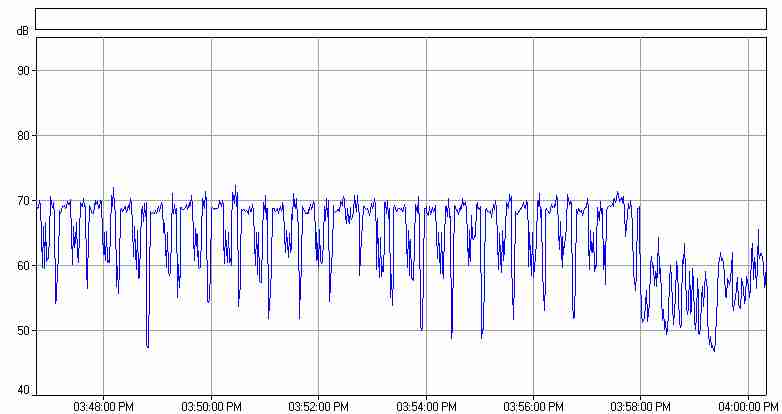
End of noise readings. That is just before and after alarm was turned off.
This page is maintained by
The Rivermouth Action Group Inc
as a community service.
E-mail: activist@rag.org.au